
Stock Market Crash
A stock market crash can occur at any time- do you know the signs?
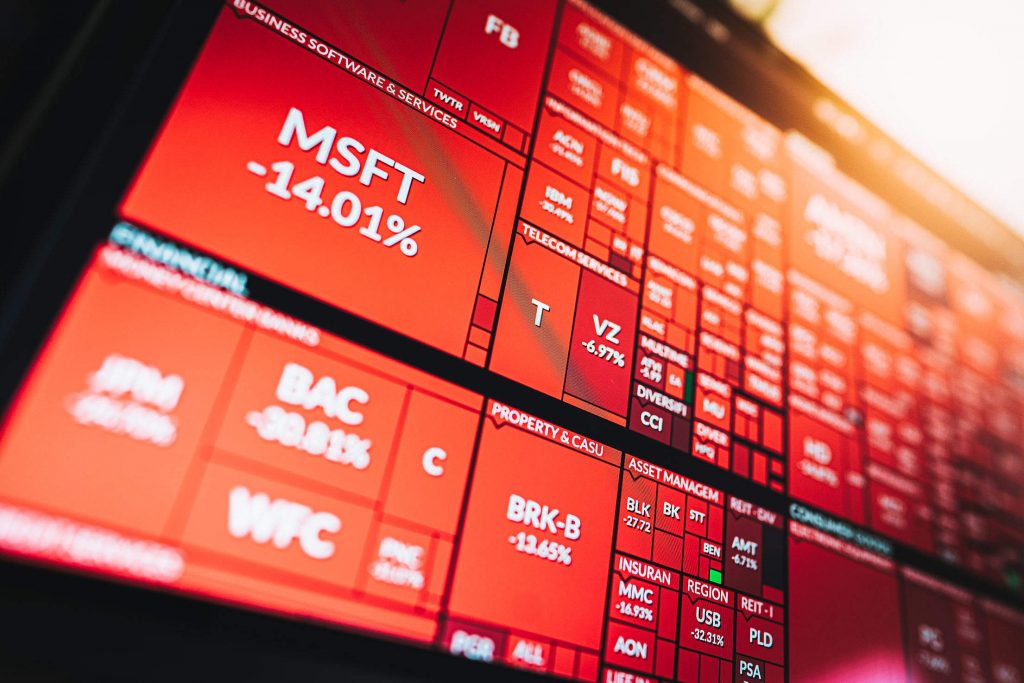
A stock market crash is a sudden and dramatic sell-off in the stock market. It’s usually preceded by a “bubble” of un-warranted buying, driving the price up. It’s usually accompanied with and followed by panic selling and fortunes lost. Do you know how to avoid them?
That’s a good question.
You might have heard the old saying: “Those who don’t know history are doomed to repeat it.” by Edmund Burke.
We like to think that the reciprocal of that is true; those who do know history are able to avoid it. Aha!
So, let’s now take a walk down memory lane into some of the greatest stock market crashes this world has ever seen.
The Wall Street Crash of 1929
Ahh, we remember it like it was yesterday. Panic, death, and despair. The wall street crash of 1929 is considered the most devastating of market crashes, considering the fact that it threw the U.S. economy into the Great Depression shortly afterwards. Here’s a graph of what the stock market looked like during the crash, courtesy of Wikipedia:
Here’s what actually happened:
Excessive speculation lead to everyone being in the market. Everyone being in the market lead to a bubble. And that bubble burst.
More specifically, the “Roaring Twenties” were a time of prosperity, disposable income, and excessive capital. During the late 20s, that excessive capital was used by the public to heavily speculate in the stock market.
There were so many individuals invested in the stock market that there was no one left to buy.
It’s weird to think about, but there’s only a finite amount of capital that can be invested in the stock market. If everyone is in the market, who is there that is left to buy? When you have all of the money out of the stock market, you have only upside potential. When you have all of the money in the stock market, you have only downside potential.
There were two specific traders that recognized that axiom back in 1929; Bernard Baruch, and Jesse Livermore.
Baruch sold all of his shares right before the crash after receiving a stock tip from the boy that shined his shoes daily. He knew that if this lowly shoe shiner was participating in the market, it was over-saturated and bound for a fall.
Livermore did one better- he sold short the market and was worth over 100 million dollars after the crash! Talk about kicking Wall St. when it’s down. A few prominent bankers from Wall St. even came to his house to convince him to stop selling the market short. One of the thing Livermore recognized was margin; which leads us to another reason the stock market crash of 1929 occurred:
Excessive margin.
People were borrowing excessive amounts of money to finance their stock trades. If you’ve ever traded on margin, you know how risky it can be. Picture that, with nine out of ten investors buying stocks on ridiculous amounts of margin; 50%, 75% and more.
In short, the market was over-inflated. Investors borrowed money, bought shares, pushed the prices higher, and when there was no one else to buy, it crashed. Bubbles. Gotta love ’em.
The Dot Com Bubble
The Dot Com Bubble was another great stock market crash that shook the world in the year 2000.
It all started with the implementation of widespread computer usage. In business, primarily, but then in consumer and public life. This crash is a good example of: “What you don’t know can hurt you.”
Specifically, the “internet age” of 1997-2000 was filled with venture capitalists who would throw money at the best looking tech company within reach. The problem was, they didn’t fully grasp the core company concepts. They didn’t quite know, and it did hurt them. How much it hurt them can be visually displayed on this graph, again, courtesy of Wikipedia.org:
This differed slightly from the 1929 crash, which was brought about primarily through the use of excessive margin and market participation.
Although, don’t count out completely the idea that the Dot-Com Bubble didn’t have debt involved.
Another reason attributed to the crash was that tech companies, during the 1990’s and early 2000’s, began a fad of paying their employees in stock options. In short, they were using debt to finance their operations. Excessive debt.
Something that can be taken away from the Dot-Com Bubble is the use of P/E Ratios. Now, we have to offer a caveat. Some people love P/E’s and swear by them; some people think they’re blasphemy and stay away. Over here at the Marketeers HQ, we don’t focus too much on them. But something can be said for them in terms of determining whether a stock’s price is artificially inflated, as the tech stocks of 1999 were.
A high P/E ratio means that the stock’s price is relatively high when compared to earnings. If the stock’s earnings have a consistent and high growth rate, a high P/E ratio can be justified. However, when earnings do not have a consistently high track record, and fundamentals are sub-par at best, a high P/E ratio can be a bright red flag.
And that’s exactly what happened in 2000. Companies had exorbitant P/E ratios, with virtually no earnings to back them up. Some companies had no earnings even to speak of. That has “bubble” written all over it.
Add that one to your tool-kit. Your portfolio will thank you.
Subprime Mortgage Bubble
This is a stock market crash you’ve probably experienced. The subprime mortgage bubble. It happened from 2007-2008, throwing the economy into the worst recession it’s seen since the Great Depression.
The causes for this bubble are many, and complicated. So we’ll keep it simple.
Simply put, “subprime loans” were the fad among financeers- subprime loans being loans given at high interest rates to individuals who may have difficulty maintaining payments. These loans often had “adjustable rates”, which meant that the interest rate you had to pay on the loan could go up or down without warning.
Banks were giving out subprime loans like candy. Investors (and unqualified homeowners) were loving it. Until the bubble burst, as it always does.
Hmm, debt playing a part in another financial crisis. We’re beginning to see a pattern here.
Though the crisis revolved around mortgages, the real estate market, and loans, the stock market and economy were hit hard. As displayed on this graph cordially brought to you by Money.Msn.com:
The S&P; went from ~1500 to ~700. Ouch. Needless to say, trillions of paper dollars were lost in the crisis.
Are you beginning to see some recurring themes here?
-Undue speculation, resulting in higher-than-average- P/E ratios.
-Excessive use of debt to finance operations.
-Everyone doing one particular thing. I.e. buying technology stocks, buying on margin, dishing out sub-prime loans, etc.
Also, keep in mind your technical sell signals, like Climax Tops, Moving Average line crossovers, and high downside volume. They can get you out of the next stock market crash.
(P.S. we’ve said it before, and we’ll say it again. A great book that goes over crashes and bubbles is “Extraordinary Popular Delusions and the Madness of Crowds by Charles MacKay. Check it out.)
We’re the Stock Marketeers, and we approve of this message.